
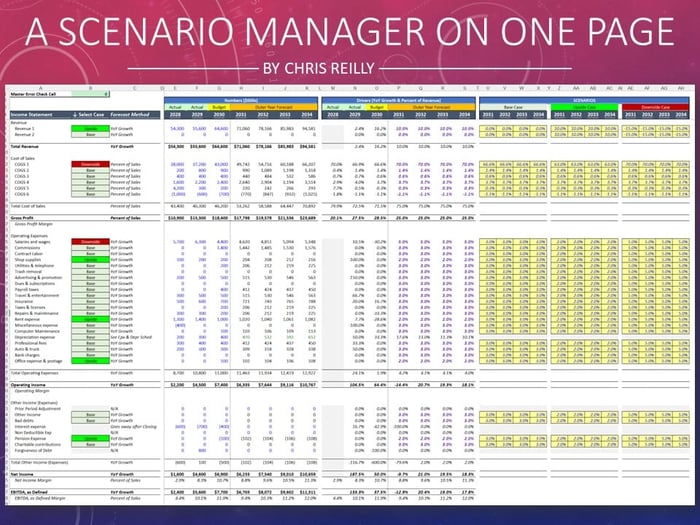
Selecting Scenarios
We’re using the classic Base, Upside, & Downside as scenarios in this example.
The scenarios can be selected in Column B using a drop-down list. This allows the user to build a scenario on a line-by-line basis.
Modeling Scenarios
On the right side of the sheet, the user can input assumptions for each of the cases (Base, Upside, & Downside).
The “modeling magic” shows up in the purple formulas. This formula looks at the drop-down list from Column B, and pulls the respective assumption from one of the three cases.
Whatever is in purple I consider the “live scenario.” A favorite amongst modelers is to use the =CHOOSE function here, however for this build I just used a basic IF statement.
Model Flow Thru
The live scenario “flows down” through the monthly model, which is built on a separate sheet.
The resulting outputs are then linked back to my scenario one-pager. This allows me to quickly see the annual impact of my monthly model, but is easily controllable in one place.
Note 1: Depreciation is not impacted here, as I will typically model Capex Spend elsewhere (with its own scenarios), and let it flow through to this page.
Note 2: I will often let Debt (and Interest Expense) flow naturally based on the other changes made to the P&L.
The View from 30,000 Feet
Scenarios often take on a life of their own and require detail that can’t be modeled at this level (i.e., changes in headcount or known contracts).
What we’re solving for here is big picture, directional changes to start a conversation (the 30,000 foot view we always hear about).
Once we set a course using this view, then we can get into the weeds and model out something more detailed.
p.s. if you’d like to see the Excel version, you can grab the template here for free.