
Understanding Cohort Analysis: A Deep Dive
Cohort analysis is a powerful tool used in business analytics to understand the behavior of specific groups over time. These groups, or "cohorts," usually share common characteristics or experiences within a defined time-span.
For example, all people that subscribed to a newsletter in June 2023 would be considered part of the "June 2023 Cohort."
tl;dr: my free email series covers Financial Modeling in-depth. Sign-up here.
Why Cohort Analysis is Important
1. Identifies Patterns Over Time: By observing cohorts, businesses can identify trends and patterns that might not be visible in the broader data. This is especially useful in understanding customer behavior, product usage, and revenue trends.
2. Customized Marketing Strategies: It can help in tailoring marketing strategies. For instance, if a cohort of users who signed up for a trial in June 2023 showed high conversion rates, you can analyze what worked well and replicate it for future cohorts.
3. Enhances Customer Retention: Understanding how different cohorts behave helps in creating strategies to improve customer retention. If a cohort shows declining engagement, targeted interventions can be planned.
Implementing Cohort Analysis: A Step-by-Step Guide
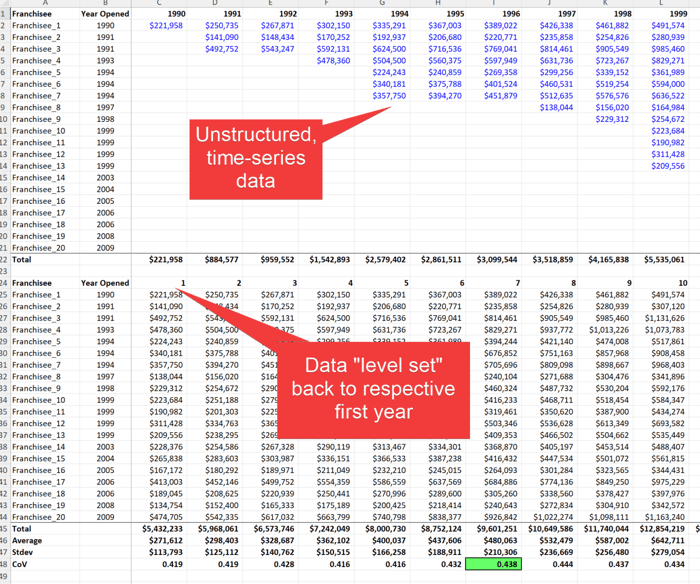
1. Defining the Cohort: The first step is defining the cohort. In this example, it's franchisees grouped by their opening year. This could also be customers grouped by their purchase month, or students by their enrollment quarter.
2. Level Setting Data: This is a crucial step where you align the start point of all members of a cohort to a common baseline. In this example, it means aligning all franchisees to their first year of operation, regardless of the actual calendar year they opened.
3. Tracking Over Time: Once cohorts are defined and data is level-set, you track various metrics over time. This could include revenue, customer engagement, or any other relevant KPI. In this example I'm looking at Averages, Standard Deviations, and Coefficients of Variation.
Advantages of Level-Set Cohort Analysis
1. Simplified Comparison: It becomes easier to compare the performance of different cohorts as if they started at the same time. This is particularly useful in businesses with seasonal variations or those that see significant changes over years.
2. Actionable Insights: This analysis provides valuable insights like average performance by year, growth trends, and standard deviations. These insights are crucial for strategic decision-making.
3. Benchmarking and Anomaly Detection: For new locations or franchisees, this analysis serves as a benchmark. It also helps in quickly identifying outliers or anomalies in performance.
Cohort Analysis in Financial Modeling
In the context of financial modeling, cohort analysis can be a game-changer. It allows financial analysts to forecast more accurately, understand revenue trends, and make informed investment decisions. For FP&A and private equity professionals, this means a more nuanced understanding of the portfolio companies or investment opportunities.
Conclusion: More Than Just Data
Cohort analysis is not just about organizing data; it's about extracting meaningful insights that can guide strategic decisions. It turns a simple dataset into a roadmap for action. Whether it's for understanding customer behavior, evaluating business performance, or making investment decisions, cohort analysis is an indispensable tool in the arsenal of a financial analyst.
Interested in Private Equity or FP&A? Join my free email series and go-depth on the intersection of Financial Modeling, Private Equity, and FP&A to help make you a better Financial Modeler. Sign-up free here.