
Building on What We've Discussed
In the last couple of issues we've talked through some financial modeling best practices.
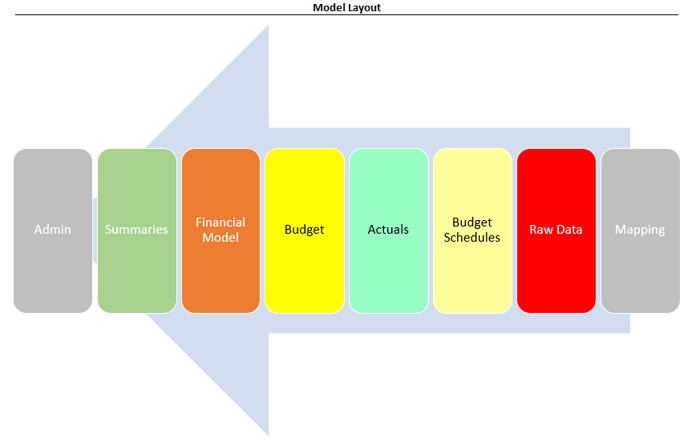
But, how about a layout for an entire model, what might that look like?
After many years of working through busted models, errors, poor formatting and sleepless nights, I've developed a layout that works for nearly every model I build (grounded in best practices).
For context, this would be a layout for a 3-Statement Model (utilizing a combo of horizontal and vertical modeling), but you could apply it to any analysis you're working on.
I'll talk through each piece so you can use it too.
Wait Isn't There Software That Does This?
(A quick rant on this...)
You know, I feel like I see this online everyday. I'll make an Excel post and someone says "hey Chris don't use Excel, use [software] instead."
I'll say this -- you (and I) should always keep our ears to the market on financial planning software, as there are constantly great strides being made in the world of data aggregation, automation, and collaboration.
However, time and again when I review this software, it is usually limited in some key functionality that I need in a model, especially when it comes to M&A.
In addition, 1.1 billion people use Microsoft's Productivity Services. That's 1 in every 8 people in the world. So, while we don't have an exact number of Excel users, it's safe to assume it's a large portion of that 1.1 billion.
Lastly, Microsoft Office is so much cheaper than financial software that it's hard to beat that value proposition.
So, to close out my rant, unless and until a holistic software solution comes out, I think one of the best skills you can develop is to go deep on Excel, which means understanding how to build a good model.
Alright, moving on...
Section 1: Mapping (gray)
I'll make a large list of all the chart of accounts, but then add an adjacent column to group them into buckets for a more digestible presentation.
For example, I might classify Salary, Bonus, Payroll Taxes, and Benefits into "Labor."
Section 2: Raw Data (red)
I will usually copy/paste data from an accounting system directly into my model, often exported as a CSV.
A more sophisticated approach is to use PowerQuery to clean things up, but that is often beyond the understanding of a lot of people I work with.
Section 3: Budget Schedules (light yellow)
Some of my model can be forecast in a single line. For example, I might want to grow "Office Supplies" by 4%. Easy enough, I can build that right into my Budget tab (bright yellow).
Other line items, however, require more thought and detail. For example, Revenue, Headcount, Capital Projects, Known Contracts, etc.
These detailed items need their own tab or "schedule," the subtotal of which will be pulled into my Budget (bright yellow).
Section 4: Actuals (bright green)
This is just a consolidation of the Raw Data into a time series format, i.e., each month laid out next to one another.
You never know when the old Raw Data won't be available anymore, so I make sure to store everything here in the Actuals.
The Actuals should leverage any mapping done on the Mapping tab earlier in terms of aggregating the chart of accounts.
Section 5: Budget (bright yellow)
Easy to build, this is just a duplicate of the Actuals tab, but the forecast period either:
- Links to one of my Budget Schedules, or;
- Has a growth assumption right then-and-there like Year-over-Year Growth, Percent of Revenue, etc.
So now, it has actual data for my history, and a clean forecast for the future (and the chart of accounts should also be mapped according to the Mapping tab).
Section 6: Financial Model (orange)
It all comes together here in a dynamic 3-Statement Model.
Given all the support I have, it's actually fairly easy to update.
I have a "Latest_Actuals" cell sitting on my Admin tab and I will update this cell each month. My 3-Statement Model will then pull Actuals if available, else, pull my Budget.
The Balance Sheet and Statement of Cash Flows update automatically from there.
This sheet is most commonly modeled as a "vertical model" (more on that next week).
Section 7: Summaries (green)
I'm just pulling information from the Financial Model into a print-friendly one-pager.
Everyone wants to see summaries in their own way, so I've learned to build the model as a standalone module (that I trust), and then build printable summaries thereafter.
Section 8: Admin (gray)
Last section but the most critical.
This section consolidates all of the potential errors in one place as well as houses the "Latest_Actuals" cell I mentioned earlier and other global update options.
Closing Out
It doesn't matter if this is a basic 3 Statement Model for FP&A or a full, multi-company roll-up for M&A, the layout is effectively the same.
I will likely have more tabs and sub-schedules, but it will still come together using this best practice:
Output <--- Calculations <--- Data (from Right to Left)
That's it for this one. See you next time.
—Chris
Before you go...
"Excel skills" are dime-a-dozen. Being a business-minded Financial Modeler separates you from the pack. Go beyond the basics and learn to model like a business owner and join my Financial Modeling Courses today .
"⭐⭐⭐⭐⭐...The template and training is fantastic. Chris walks through each section thoroughly and makes a complex topic easy to understand."