

 |
Revenue growth is always the fancy, headline-grabbing number.
But not everyone stops to ask: Was that growth efficient?
Because if you’re spending $1 in sales and marketing just to get $0.60 in new revenue…
That’s not growth -- that’s burn 🔥.
That’s where the SaaS Net Magic Number comes in.
What is the SaaS Net Magic Number?
When I first heard this term, I remember thinking:
What kind of ridiculous buzzword is this?
Turns out, it's a very helpful measure of efficiency despite the cheesy name.
The SaaS Net Magic Number is a quick way to measure how efficiently your company is converting sales and marketing spend into new recurring revenue.
Here’s the most common formula:
You’re basically annualizing the revenue growth from this quarter, and comparing it to what you spent last quarter to achieve it.
The resulting ratio is a measure of efficiency.
How to Interpret the SaaS Net Magic Number
- 🟢 Over 1.0x → Solid / Efficient.
You’re generating more than $1 in new revenue for every $1 spent last quarter. - 🟡 0.75x – 1.0x → Mixed.
Some things are working, but there’s likely room to tighten up. - 🔴 Under 0.75x → Not great / Inefficient.
You’re probably overspending or leaking efficiency somewhere.
Example From the Model
Here’s an example from my SaaS Model Template:
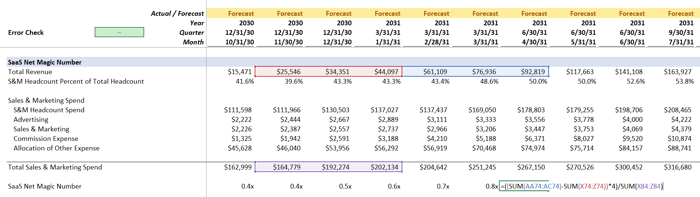 |
First, I calculate the change in GAAP revenue quarter-over-quarter, and annualize it (numerator).
Then, I compare the revenue to the Sales & Marketing spend from the prior quarter (denominator), which includes:
- S&M Headcount Spend
- Advertising
- Sales & Marketing team costs
- Commission expense
- Pro rata allocation of other company-wide expenses
This "layered approach" gives you a much more realistic view of what you’re spending to drive growth -- not just what’s sitting in the “Sales & Marketing” line of your P&L.
(and based on models I've seen, people often under-estimate the true S&M spend)
In the example, we go from 0.4x to 0.8x -- typically indicative of an earlier-stage company that is spending aggressively on growth, hoping to capture more revenue down the line.
Still below the 1.0x benchmark, but heading in the right direction.
Note on ARR vs GAAP Revenue
 |
Some companies prefer to use ARR instead of GAAP revenue for this formula, especially in early-stage SaaS or with annual contracts.
That's because the ARR version reflects contracted growth, not just what's been recognized under revenue accounting rules.
In other words, if you're selling annual contracts or collecting payments upfront, GAAP revenue can lag behind actual sales -- which means your growth might look slower than it really is.
That version looks like this:
(btw, you don't need to multiply by four because ARR is already an annual number)
Big picture, the idea is the same -- you’re just swapping out recognized revenue (GAAP) for booked contracts (ARR).
In your model, it can't hurt to have both (it's just another row, after all).
Just be clear with your labeling.
Final Thoughts
Although odd-sounding (and frankly, cryptic), the SaaS Net Magic Number is a practical way to measure the efficiency of your sales and marketing spend, and is a number management -- and investors -- always keep an eye on.
Thankfully, it's an easy calculation to include every month in your financial model, and is one of many SaaS metrics you can use to get a complete picture.
Most importantly, it allows you to go a layer deeper than vanity top-line metrics, and tells you if you’re building something scalable -- or just slowly setting cash on fire.
That's it for today. See you next time.
—Chris
p.s., if you enjoyed this post, then please consider checking out my Financial Modeling Courses. As featured by Wharton Online, Wall Street Prep, and LinkedIn Learning, you'll learn to build the exact models I use with Investment Banks, FP&A Teams, SaaS Companies, and Private Equity Firms 👉 Click here to learn more.