

A Private Equity Dashboard
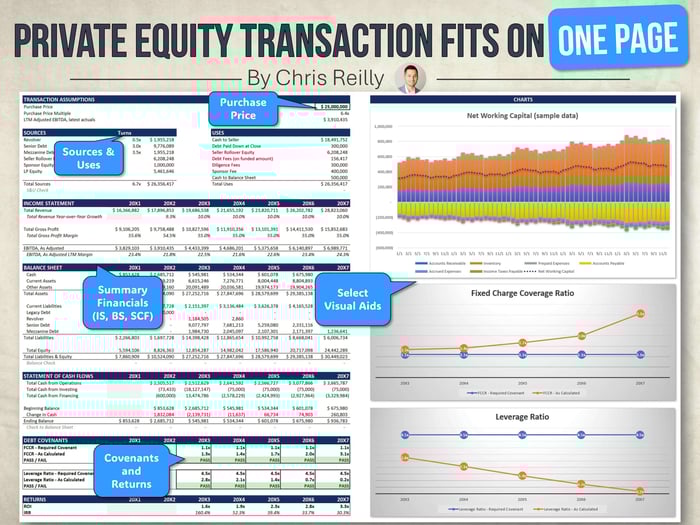 A typical output from an LBO model, explaining all the key points about the transaction. |
I share this image a lot online because it's the culmination of so much underlying modeling work.
However, I don't typically have "enough space" to explain everything in detail.
Today, I'd like to talk through all the different parts of this "LBO Output" — a critical one-pager you need to understand if you want to work in private equity.
Section 1: Transaction Assumptions
The company you're buying has a "Purchase Price," just like a house.
Typically in mid-market PE, the Purchase Price is based on a multiple of the trailing-twelve-month ("TTM") Adjusted EBITDA, which is calculated in your financial model.
A "fair multiple" is typically dictated by recent transactions in the market (and you can get this info from places like Pitchbook or GF Data).
Simple example: If similar companies recently sold for 6.0x - 8.0x TTM Adjusted EBITDA, then you could argue a 7.0x multiple is reasonable or fair.
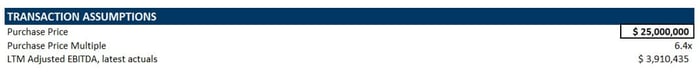 In the model, I'm showing a $25mm Purchase Price and implied multiple of 6.4x. |
When it comes to modeling, typically the process goes like this:
- Make the Multiple an Input and the Purchase Price an Output (and this is usually done early on when you're still figuring out the financials), then;
- Flip things around: Make the Purchase Price an Input and the Multiple an Output (usually done after an LOI is in place and there's a formal Purchase Price written in a document)
The Purchase Price is the north star of your LBO model, so make sure it matches the LOI by building a double-check (learned this one the hard way).
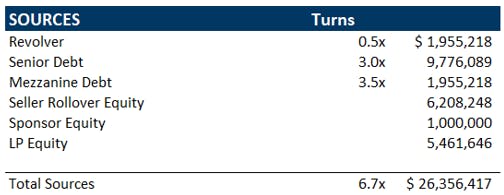
Section 2: Sources and Uses
The Purchase Price has to be paid for, somehow.
When you buy a house, the sources and uses typically look like this:
Sources:
- Down-payment (equity)
- Mortgage
Uses:
- Purchase the house
In private equity, the concept is very similar, with a few extra layers:
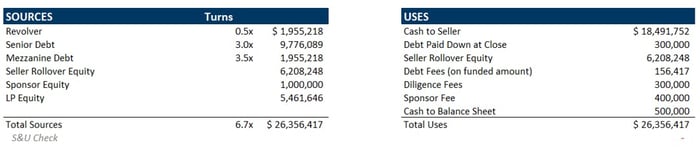 Sources and Uses of a typical private equity transaction. Sources and Uses of a typical private equity transaction. |
Notice how the Total Uses are actually $26,356,417 and not $25,000,000 (the Purchase Price)?
That's because we have to pay fees in addition to the Purchase Price to get the deal done.
So the total cost is actually higher than the Purchase Price, which in turn increases your purchase multiple (notice it's now 6.7x instead of 6.4x from above).
The $25,000,000 Purchase Price goes as follows:
- $300,000 to pay down debt (just like when you sell a house, you have to pay off the mortgage first before you make a return on your equity), then;
- $6,208,248 of "Seller Rollover" (think of this like the seller gets paid out, but then immediately buys back in to the new business as a partial owner), then;
- $18,491,752 remainder goes directly to the seller in cold hard cash, in their bank account.
Then, the $1,356,417 in fees works like this:
- $156,417 fees required as part of raising debt for the deal (note the Revolver, Senior Debt, and Mezzanine Debt on the "Sources" side)
- $300,000 diligence fees (think lawyers, accountants, and consultants that help with diligence to get the deal done)
- $400,000 sponsor fee (PE firms will often pay themselves to compensate for the effort that goes into closing the deal)
- $500,000 cash to balance sheet (a small cash amount to the balance sheet to help manage working capital after the deal closes, since the seller is entitled to all the existing cash in the business (which is in addition to the $25mm purchase price)).
Now that you've got your Total Uses of $26,356,417, you have to figure out how you'll pay:
Lenders have a maximum amount of debt they're willing to lend you, often called "turns," which is just another word for "multiple of EBITDA."
- In this model, the lender has offered 3.5x "turns" of debt, or $13,686,525 (broken into three "tranches" of Revolver, Senior Debt, and Mezzanine Debt)
 In total, the lender has offered 3.5x "turns" of debt, or $13,686,525 (broken into three "tranches" of Revolver, Senior Debt, and Mezzanine Debt). |
The remaining $12,669,894 comes from equity:
- The $6,208,248 of Seller Rollover is both a source and use (tricky at first, but remember, this is cash the seller just received — so pretend they turned right around and brought the ~$6.2mm back into the deal to help purchase it — a source and a use)
- The $1,000,000 of "Sponsor Equity" comes directly from the professionals at the private equity firm (btw, "Sponsor" is just another term for "PE firm). Often times, the PE professionals will invest their own equity into the deal (and this is a good sign if you're an LP)
- The remaining $5,461,646 comes from the LPs or "Limited Partners" (aka the investors in the PE fund). This is the last source because everything has been accounted for. So in your model, this is technically a plug, because everything else is known.
Section 3: Summary Income Statement
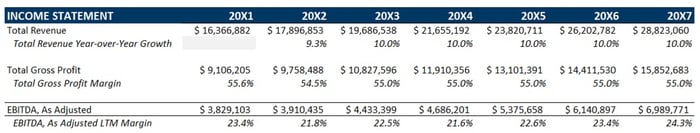 Summary Income Statement, only the most important parts. |
From there things get much easier — we just need high-level, summary stuff.
Let's start with a "big picture Income Statement."
Here, the Managing Partners just need the key items:
- Revenue and growth rate (note the model shows 10% YoY growth)
- Gross Margin (note the model shows 55% margin each year)
- EBITDA and margin (the improved margin each year is called "operating leverage," which is effectively reaping the benefit of using fixed operating costs to help scale the business)
Section 4: Summary Balance Sheet
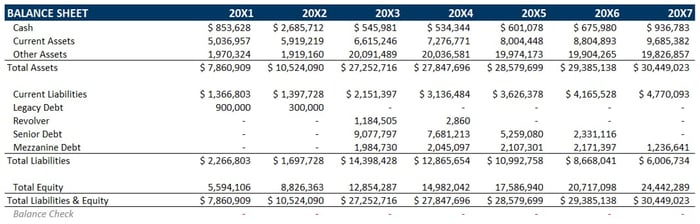 Summary Balance Sheet that hits on the high points, especially the debt balances. |
Next, the "summary Balance Sheet" typically has more detail than the Income Statement because we're using so much debt to acquire the company, so the Partners want to see those debt balances decreasing over time.
First though, everyone needs to know Cash, so it's called out separately at the top of the schedule. The other assets aren't as important in this view.
Flipping to the liabilities side, you can see the Revolver getting paid off first, then the Senior Debt, then the Mezzanine debt. This is done by building a cash flow sweep in your model that pays down or "waterfalls" debt in order of priority.
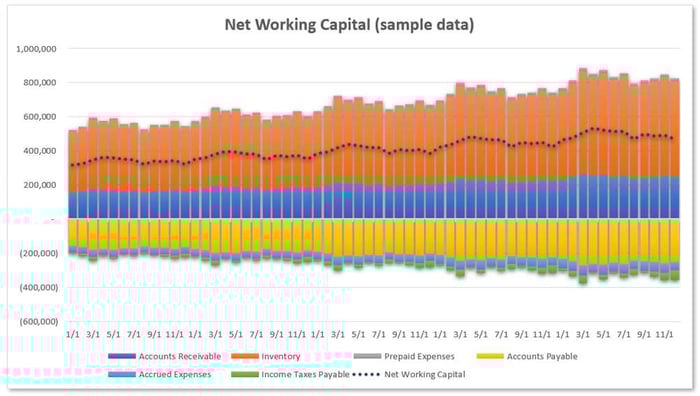 Bonus: you can add a graph like this so the Partners can "see" the working capital over time. Not necessary, but helpful. |
Section 5: Summary Statement of Cash Flows
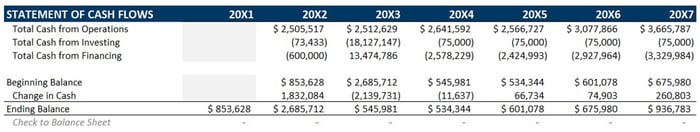 Line-by-line detail not needed here — just the "big stuff" is fine. |
Next is a "summary Statement of Cash Flows." Similar to the Income Statement, we don't need a ton of detail here, just the "big picture items."
You probably recall the Statement of Cash Flows is broken into three sections: Cash from Operations, Cash from Investing, and Cash from Financing.
We can show these three sections, plus the "Change in Cash" at the bottom, and that's sufficient.
The Partners are looking to see if the company is generating Operating Cash flow each year (since the Income Statement is reported on an accrual basis), and you can see the company is projected to generate ~$2.5mm - ~$3.5mm Operating Cash Flow each year.
1. Do you know what the ~$18.1 million outflow is in the Investing section in 20X3?
2. What about the ~$2.5mm - ~$3.3mm outflows each year in the Financing section?
Section 6: Covenants and Returns
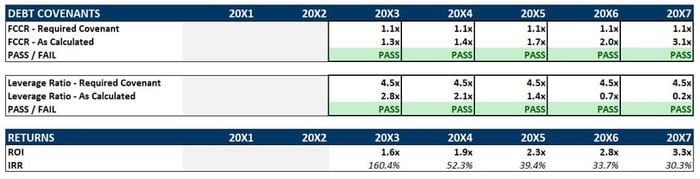 The most important part of the model: Covenants and Returns. The most important part of the model: Covenants and Returns. |
Covenants and Returns are the most important part of your LBO model, and they will make or break the entire deal.
6a) Covenants
Think of Covenants like a "financial health check" for the business — we're ensuring the business is "financially healthy enough" to sustain its levels of debt and make interest payments.
Fixed Charge Coverage Ratio
 Fixed Charge Coverage Ratio: Does the company generate enough cash to cover principal and interest payments? Fixed Charge Coverage Ratio: Does the company generate enough cash to cover principal and interest payments? |
Here we're showing the lender that the business generates enough cash to cover its fixed charges, which is typically interest and principal payments.
The lender has asked for 1.1x coverage, meaning "you can cover the charges plus a little extra," and our model shows we're going from 1.3x all the way up to 3.1x (since they debt gets smaller over time, the interest payments decrease).
Leverage Ratio
 Leverage Ratio: is the lender adequately collateralized in a distressed sale? Leverage Ratio: is the lender adequately collateralized in a distressed sale? |
Here the lender is saying, "we don't ever want debt to exceed 4.5x turns of EBITDA, because otherwise we probably wouldn't be able to recoup our loan in a sale."
Remember that that lender gets their investment back first, so the leverage ratio ensures the lender is adequately collateralized (in other words, the business can still sell and the lender can get their money back).
The lower the better here, because it means the company has less debt (again, this all comes from paying down debt over time using the cash flow sweep).
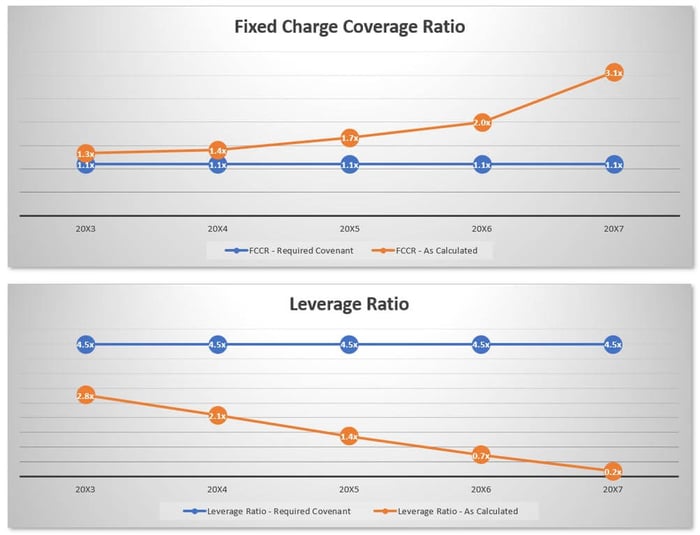 Bonus: you can add graphs like this to make the covenants easier to "see." See how both the Fixed Charge Coverage Ratio and Leverage Ratios improve over time? That's due to the cash flow sweep (and improved operations) from the financial model. Bonus: you can add graphs like this to make the covenants easier to "see." See how both the Fixed Charge Coverage Ratio and Leverage Ratios improve over time? That's due to the cash flow sweep (and improved operations) from the financial model. |
6b) Returns
 What return on investment can we expect for out investors? What return on investment can we expect for out investors? |
If our "financial health check" (Covenants) look good, then that means the lender is probably comfortable financing the deal.
But, what about our equity holders? We have to see what kind of return we can expect over the life of the deal.
Just like when you sell your house, you're hoping for some of kind of profit or return on your equity, the same holds true in private equity — what kind of return can we expect for our investors?
It Better Be Good
Here's what I mean... you or I can open a brokerage account right now and in theory earn 7-10% per year investing in index funds. In addition, I can sell my position any time and have cash, so it's relatively liquid as well (*not financial advice*).
In private equity, investors are putting their money in something illiquid (they can only realize proceeds when the PE firm exits), in a private market so there's less visibility, and they have to pay management fees in addition to their investment — so the returns need to be much better than what they can achieve in the public markets to compensate them for the additional risk, making this the key output from the entire model.
In the model, you can see that by year 5, the investors are looking at 3.3x and 30.3% IRR. This is a nice return (compare the 30.3% to the 7-10% I mentioned earlier).
In other words, this investment should generate about 3.0x the opportunity that is available in the public markets.
(Note, a typical "benchmark / goalpost " in an LBO model is 3.0x over 5 years, which equals a ~25% IRR).
So, if (1) the lenders are set and (2) we've got an attractive opportunity for our investors, then our deal is "looking good" and we're ready to distribute this output to a larger audience and move forward with the deal (which means spending real money on consultants, accountants, lawyers, contacting lenders, and preparing our investors).
Zooming Out
This turned into quite a post! Like I said at the beginning, we're communicating a ton of detail in this one-page report.
The most important things to keep in mind:
- Do the covenants look good for lenders?
- Do the returns look good for investors?
If you're interested, we build several similar dashboards / outputs in the Ultimate Financial Modeling Program — check it out if you'd like.
That's it for today. See you next time.
—Chris
📜Quiz Answers:
- The ~$18.1 million outflow in the Investing section is the "use" of cash going to purchase the business when the deal closes (and you can see the offsetting ~$13.4 million inflow in the financing section, which are the "sources." Any proceeds above-and-beyond the book value of the equity gets recorded as Goodwill on the balance sheet.
- The ~$2.5mm - ~$3.3mm outflows each year in the Financing section is the automatic paydown of debt using the cash flow sweep. This is why the fixed charge and leverage ratios improve over the life of the deal.