
What's a Seasonality Curve?
Not all business out there consistently generate Revenue each and every month.
Lots of business are considered "seasonal," meaning they generate most of their Revenue during a particular part (or parts) of the year.
A few basic examples:
- Holiday-related businesses (Spirit Halloween anyone?)
- Ski Resorts (mostly a winter business)
- Agriculture (based on growing seasons)
- Academic businesses (typically follow the school year)
So, how do we model that season? Let's discuss...
What a Seasonality Curve Looks Like
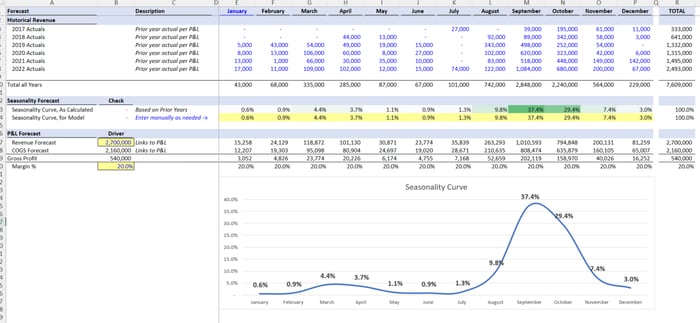
In the image above, I've got several years' worth of data all crammed together that eventually molds into a "weighted average curve" that I will use for the coming year.
Here are the steps...
Look at the History
In the "Historical Revenue" section I pull together several years of history (if available) and stack them together by month.
At the bottom I calculate "Total of All Years" which gives me a grand total by month over the last [X] years (six years in this example).
Seasonality Forecast
I take the respective monthly totals and divide them by the grand total Revenue over that time period.
This gives me my "Seasonality Curve, As Calculated," which serves as a reference point for the forecast (a weighted-average of the history).
Then, right below that, I have "Seasonality Curve, for Model," which allows the user to make any changes to the expected seasonality curve for this year.
(Default is just to leave the curve alone)
P&L Forecast
Now that I have my curve, I simply punch in the expected Revenue and Gross Margin (the two light-yellow input cells), and extrapolate those figures for each month based on the seasonality curve.
The Revenue and Margin forecasts come from the Management Team.
My job as the FP&A Professional is challenge their assumptions:
- Will our seasonality be different this year?
- Why $2.7mm?
- Why 20% Margin?
Link to Model
The Revenue and COGS get linked back to my 3 Statement Model.
If I need to make changes, I come back to my seasonality tab, make the change, and trust that my 3 Statement Model will update accordingly.
Check my Work
Lastly, I will always have double-checks confirming:
- My seasonality curve equals 100%
- The Revenue and COGS in the Schedule match the 3 Statement Model
- The Gross Profit in the Schedule matches the 3 Statement Model
All of these double-checks will feed into a Control Panel I have as the first page in my file.
Duplicate as Needed
For a new product line I just type "Alt + e + m," create a copy of the tab, and rename for a new product line (that's the Excel shortcut).
I'll build as many small, simple schedules as I need to create a comprehensive model that is easy to follow.
Conclusion
In summary, the steps are:
- Aggregate historical data
- Create a weighted-average curve
- Layer forecast into Three Statement Model
- Discuss with team and iterate as needed
- Duplicate process for additional seasonal line items
That's it for today. See you next time.
—Chris
p.s. if you're enjoying these free emails and not in the market for a course right now, I'd be so grateful if you'd consider leaving a tip to support my future work ❤️.