
Intro
Let’s get “into the weeds” a bit this week and talk through a critical skill for financial modeling: how to model the Working Capital.
In Part 1, I’ll start with the “Classic" method which is to say using the Income Statement (Revenue & COGS) plus common working capital statistics (DSO, DPO, DOH) to back into the working capital balances.
In Part 2, I'll talk through my preferred approach, the "BASE" or "Corkscrew" method.
tl;dr: prefer video? You might like my courses instead. Check them out here.
Part 1: The Classic Method
Best for: situations where you have limited visibility into the collections and payables cycle and want to create a directional assumption that is consistent month-over-month.
It's considered "classic" because this is usually what we need to start with.
Revenue
Revenue is pulled directly from the Income Statement where presumably I’ve already come up with a forecast for the coming year.
COGS
Also pulls directly from Income Statement and accompanies my Revenue forecast.
Accounts Receivable
For history: pulls directly from Balance Sheet (which likely pulls from an accounting system)
For forecast: calculated using DSO assumption (Average AR / Revenue) x [time]
Formula: (Revenue / [time]) x DSO
DSO (Days Sales Outstanding)
Means: How long on average it takes us to get paid
For history: (Avg AR / Revenue) x [time] (in this case 90 days)
For forecast: equals most recent DSO assumption
Accounts Payable
For history: pulls directly from Balance Sheet (same as above)
For forecast: calculated using DPO assumption (Average AP / COGS) x [time]
Formula: (COGS / [time]) x DPO
DPO (Days Payable Outstanding)
Means: How long on average it takes us to pay our vendors
For history: (Avg AP / COGS) x [time] (in this case 90 days)
For forecast: equals most recent DPO assumption
Inventory
For history: pulls directly from Balance Sheet (same as above)
For forecast: calculated using DOH assumption (Average Inventory / COGS) x [time]
Formula: (COGS / [time]) x DOH
DOH (Days on Hand)
Means: How many days of Inventory we keep stocked
For history: (Avg Inv / COGS) x [time] (in this case 90 days)
For forecast: equals most recent DOH assumption
Prepaid & Accrued Expenses
For history: pulled directly from Balance Sheet (same as above)
For forecast: calculated as % of Revenue, % of SG&A (+/- COGS) depending on what is accrued
Formatting
In this image I make it very clear / manual as to when the formulas “switch over.”
The orange highlight denotes moving from Actual to Forecast, and the yellow shading does the same for the inputs.
Scalability
In fancier models I will make these formulas “switch” automatically based on whether the month is Actual or Forecast and use an IF statement.
If the working capital is irregular or seasonal, I will always include a manual override option (not shown here), since DSO, DPO, and DOH likely wouldn’t be helpful.
Part 2: The BASE or Corkscrew Method
Best for: situations where you have better visibility into the collections and payables cycle and want to create working capital with more custom logic.
This is my preferred approach because it is easier to audit and allows for custom logic.
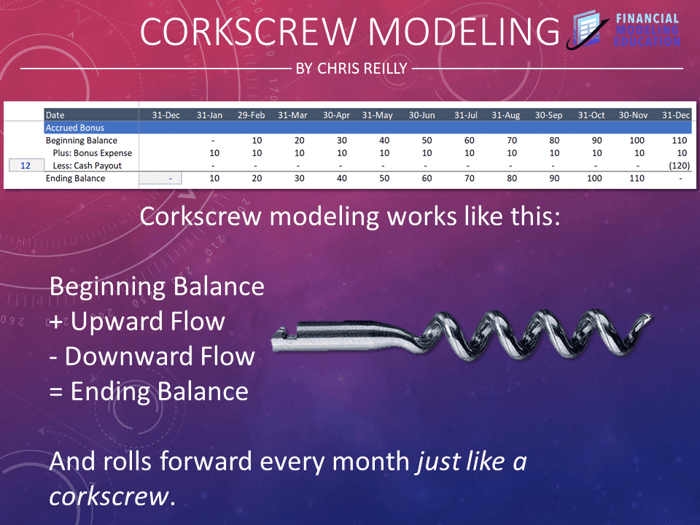
BASE or Corkscrew modeling works like this:
B: Beginning Balance A: +Addition ("upward flow") S: -Subtraction ("downward flow") E: Ending Balance
The "corkscrew" concept comes from the idea that next month's beginning balance is last month's ending balance. So the whole thing "rolls forward" like a corkscrew (check the image above).
Here’s an example using Accounts Receivable:
B: Beginning Balance A: +Revenue S: -Cash Receipts E: Ending Balance
Another example using Fixed Assets:
B: Beginning Balance A: +Capex S: -Depreciation E: Ending Balance
And lastly, using a Bonus Accrual (matches the image):
B: Beginning Balance A: +Bonus Expense S: -Bonus Payments E: Ending Balance
This technique is:
- Particularly easy to audit
- Provides a clean bridge between accrual-based expenses and cash payments
- You can always insert more rows for new business lines or one-off customers
- You can double-check your entire model building a direct cash flow in addition to the indirect cash flow (topic for another day)
Output: Three Statement Model
Regardless of which approach you use, these outputs ultimately feed into your Balance Sheet, which affect cash in a Three Statement Model (and that's ultimately what we're solving for here).
Since we're always solving for cash (and not the perfect model), it’s very important to see how these working capital balances change throughout your forecast period with some kind of visual aid like a graph. This can help you identify outliers (especially in a seasonal business) and you can adjust your forecast from there.
That's it for today. See you next time.
—Chris
p.s., if interested, feel free to check out my self-study video courses on Financial Modeling (featured with Wharton Online Private Equity Certificate Program, Wall Street Prep, LinkedIn Learning, and more).