
Intro
Straightforward in concept, but oddly tricky to model, the Sources and Uses is a critical part of M&A modeling that you need to understand.
There are a handful of certainties in life: Life, Death, Taxes, and Sources must equal Uses (keep this in mind).
Today we discuss the 101.
Start Simple
Uses First
Imagine you walk into the grocery store to buy some apples.
They cost $10.
But when you get to the checkout counter, the total cost is actually $10.50.
That’s because you need to pay $0.50 in sales tax.
The $10.50 is the total use of cash (what the grocery store keeps before it gives us apples).
Sources Second
One way or another, if we want apples, we need to come up with $10.50.
You open your wallet, and see a five dollar bill in there.
So now you’ve got to find $5.50 from somewhere.
To solve this problem, you break out your credit card to cover the difference (or “plug” as I say in the image).
Now, we have $10.50 of total sources which match the uses.
It’s the Same In Business, just More Numbers
Now that we understand the basics, let’s look at a slightly more advanced example: purchasing a company.
Step 1: Get EBITDA from Financials
In M&A, EBITDA is your starting point (even though people love to hate it).
Pull this directly from the Financials in your model.
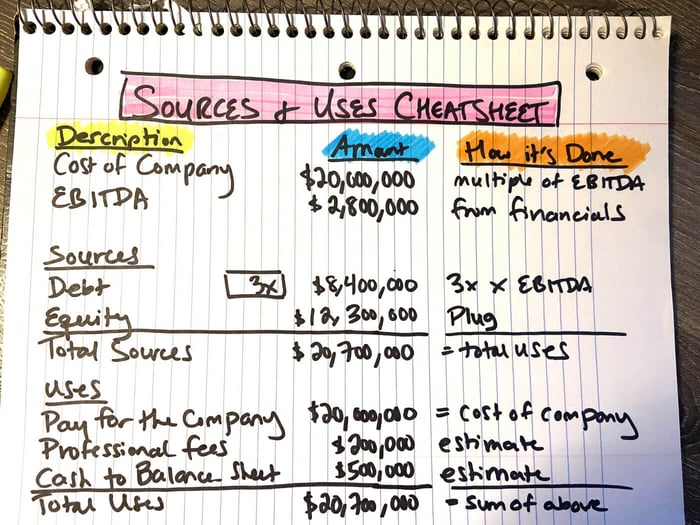
In the image, you can see EBITDA is $2.8 million.
Step 2: Value the Company
Denoted as “Cost of Company” in the image, this number is usually determined as a multiple of EBITDA.
The $20 million “cost” divided by $2.8 million of EBITDA tells me the company is “trading for” ~7.14x.
(btw, the ~7.14x would be determined by looking at comparable companies that had already been sold)
Zooming out: The $20 million from the image is the “cost of the apples.”
Step 3: Start Building Uses
The $20 million cost goes directly to the Uses.
It’s the money we need to pay to acquire the business (just like the apples).
Step 4: Add Professional Fees
All M&A deals require “Professional Fees.”
These are people who help the private equity firm complete its diligence.
Most commonly, these are lawyers and accountants, but there can be all types of service providers.
Their cost is paid at close. It’s another “use” of cash.
Think of this like the “sales tax” in the apples example.
Step 5: Add Cash to Balance Sheet
One wrinkle in M&A is that when a deal closes, the Seller gets to keep all the cash in the business.
That means, on day one, there’s actually zero cash in the bank for the new buyer.
This can create some working capital pressure.
So, often times, the Purchaser will put some cash on the Balance Sheet as part of its purchase.
(or, negotiate with the Seller to leave a “cash minimum” behind)
This finalizes our Uses: $20 million purchase + $200k fees + $500k cash to balance sheet = $20.7 million total uses.
($20.7 million = cost of apples + sales tax)
Step 6: Calculate the Debt
Now that our uses are done, it’s time to flip over to sources.
We start with what we’re able to obtain in the debt markets, which is usually limited by a multiple of EBITDA.
In the image, I’m using 3x, which means the lenders told us, “we’re willing to lend you up to 3x EBITDA of debt to help pay for the company.”
In other words, the lender will give us $8.4 million.
So now we’ve got a hole to fill.
Step 7: Calculate the Equity
We’ve got $8.4 million from the lender, but we’ve got to come up with $20.7 million total.
So that difference of $12.3 million comes from equity.
In a financial model, this figure is the plug: Total Uses — Debt Sources = Equity Plug.
Now, our sources match our uses.
Conclusion
I’ve always wished they’d call it the “Uses and the Sources.” It just makes more sense that way.
It just is what it is.
Hopefully now you know that every figure in the sources and uses is driven by an initial assumption, and the only “plug” is the equity figure at the end.
If you’d like to see a complete example in the private equity setting, I cover it in detail in my courses.
That’s it for today. See you next time.
— Chris