
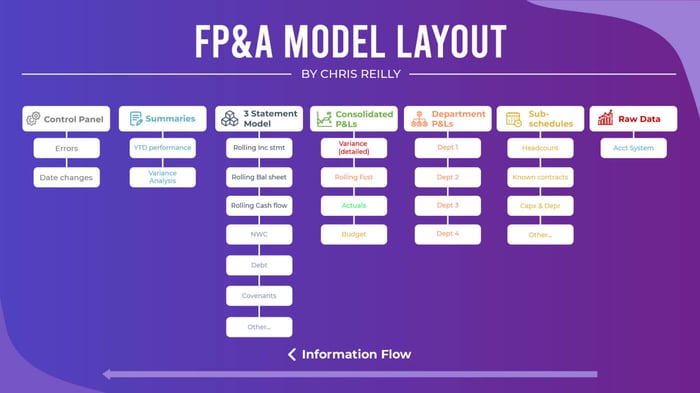
Here’s the exact layout of nearly every FP&A Operating Model I build…
The information flows from right to left, meaning:
Summaries < — — — Calculations < — — — Raw Data
Here are the parts:
1. Raw Data
This is where I’ll bring in all data from an accounting system (QuickBooks, Xero, etc.)
I don’t make any changes to the data, rather, I build my helper formulas around the data
More sophisticated approach is to use Power Query, but isn’t typically needed for my clients
2. Schedules
This is where I’ll build P&L or Balance Sheet schedules that require detail
Common examples are Headcount, Known Contracts, and Capital Expenditures (broken down by Maintenance and Growth)
These schedules link to various P&Ls / BS as needed
3. Department P&Ls
Most departments want a budget for “their stuff”
Their Revenue, their COGS, their people, etc.
Previous schedules will be mapped accordingly (i.e., Headcount, Contractors, etc.)
Excludes any “Corporate Expense” like CEO, CFO, etc.
4. Consolidated P&Ls
Have to bring it all together
Includes “Corporate Expense” like CEO, CFO, etc.
Includes Interest, Taxes, & Depreciation (Too hard to model at dept level even if actuals recorded there)
Will show 2 views:
(1) Total by Chart of Accounts (i.e., total software sales)
(2) Totals by Department (i.e., total Depts 1–4 + Corporate)
(Both should tie out)
Freeze one P&L for a “Budget”
One P&L purely grabs “Actuals” from Raw Data
One P&L is “Rolling” i.e., Actuals + Budget (If model date > latest actual date, pull Budget, else pull Actuals)
One P&L is “Variance” (Line by line comparison to budget for mgmt. to explore, will chat with department heads, etc.)
5. Three Statement Model
Condensed P&L here (or detailed if preferred)
EBITDA build
Primary purpose is to forecast cash
All (or nearly all) Balance Sheet schedules (Except for Capx & Depr)
Will be a rolling forecast each month as Actuals come in (will “freeze” budget as own file before using rolling fcst)
Modeled vertically (giant tab, 600–1,000+ rows)
6. Summaries
Print-friendly summaries of all the details
Usually presented in thousands ($000s)
Several items bucketed together
Big picture YTD performance
Various summaries built to end-user preferences
Easy to print & forward — purpose is to have conversation
7. Control Panel
Easy to update Actuals date (change one cell)
Flags business issues (Covenants, Debt Capacity, etc.)
Flags all model issues
Summaries aren’t set until all errors are fixed
This tab is often-overlooked, but truly one of the most critical to make sure your operating model is functioning correctly.
⚡My Elevator Pitch:
Short-form posts are great, but they only scratch the surface…
If you want to go in-depth in this topic, then check out my free email series the Financial Modeling Educator, which explores the intersection of Financial Modeling, FP&A, and Private Equity to help make you a better Financial Modeler.